
Key Takeaways
- A last mile delivery station is a hyperlocal fulfillment hub located within 2-15 miles of dense customer clusters.
- These stations serve as a critical link between distribution centers and the final delivery to customers.
- For Amazon brands generating over $1 million, last mile delivery stations significantly impact EBITDA by managing the most expensive logistics segment.
- Last mile delivery can account for up to 53% of total shipping expenses.
- Proximity to customers reduces fuel costs, accelerates delivery times, and improves signature capture rates.
Table of Contents
- What Is a Last Mile Delivery Station? Advanced Definitions & Direct Impact on Amazon Brand EBITDA
- Last Mile Delivery Station vs. Traditional Distribution Center, Profit, Speed, & Flexibility Comparison
- Strategic Last Mile Delivery Station Location Planning, Mapping Routes to Margin
- End-to-End Package Flow: Station SOPs for Delivery Precision and Efficiency
- Optimizing Station Operations: Automation, Fleet Management, and Real-Time Tracking for Maximum EBITDA
- Automated vs. Manual Sorting: Impact Analysis, Use Cases, and Best Practices
- Vehicle Types for Last Mile Station Delivery: Which Maximizes Delivery Margins for Amazon Sellers?
- Technology Stack for Advanced Last Mile Delivery Stations in 2025, Tools for Tactical Sellers
- Common Station Challenges & Tactical Solutions: Margin Rescue SOPs
- Case Studies: Titan Network Sellers Maximizing Profit Levers at Last Mile Stations
- FAQs: Last Mile Delivery Station Best Practices for Advanced Amazon Sellers
- Titan Network Systems & Mentorship: Scalability, Accountability, and Masterminding Your Last Mile Advantage
- Mastering Last Mile Delivery Station Operations: Your Path to Sustainable Margin Expansion
What Is a Last Mile Delivery Station? Advanced Definitions & Direct Impact on Amazon Brand EBITDA
A last mile delivery station functions as your profit margin’s final checkpoint. Unlike massive distribution centers handling regional volume, these compact hubs focus exclusively on speed-to-doorstep execution within tight geographic boundaries. The economics are brutal but controllable: every mile closer to your customer base translates to reduced fuel costs, faster delivery times, and higher signature capture rates. Best Amazon Seller Mastermind
The margin impact is immediate and measurable. Amazon’s fastest-growing Prime markets rely on station networks positioned strategically within high-LTV zip codes. When Titan Network sellers implemented proximity optimization strategies, they achieved an 18% improvement in same-day delivery rates, directly boosting customer retention and reducing costly delivery failures that erode EBITDA. Connect with Titan Network
These stations handle three critical profit levers: delivery speed (affecting customer lifetime value), operational efficiency (controlling cost per shipment), and service reliability (minimizing expensive re-delivery attempts). The difference between a 24-hour delivery window and a 4-hour window often determines whether your brand captures premium pricing or competes on commodity terms.
Last Mile Delivery Station vs. Traditional Distribution Center, Profit, Speed, & Flexibility Comparison
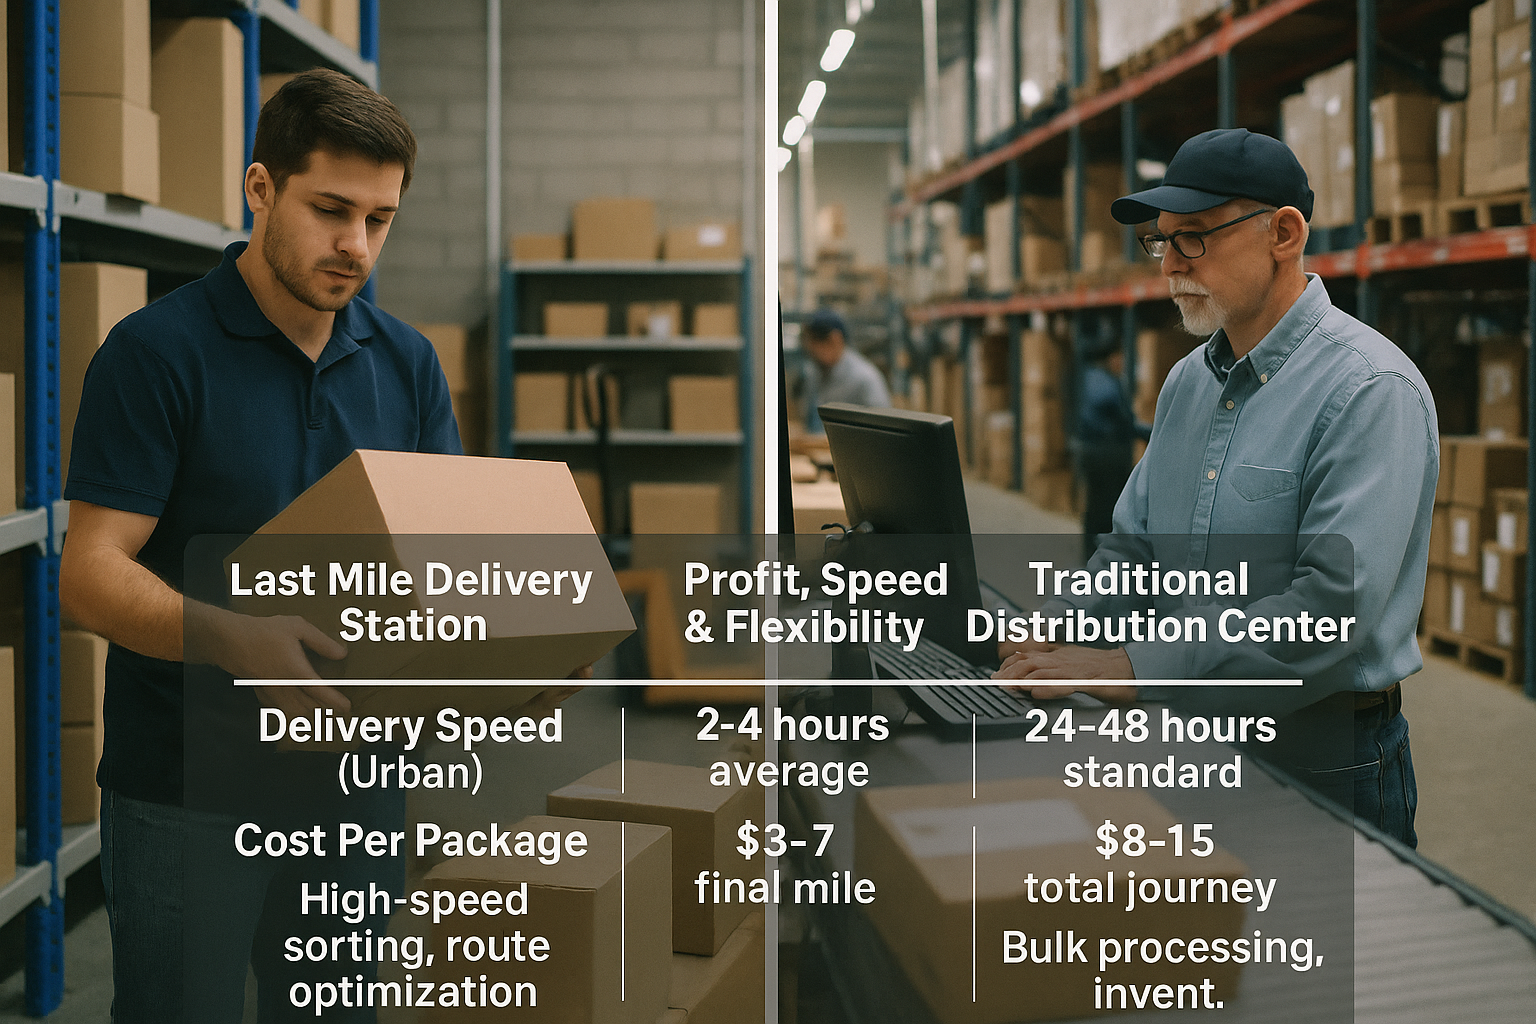
| Criteria | Last Mile Delivery Station | Traditional Distribution Center |
|---|---|---|
| Delivery Speed (Urban) | 2-4 hours average | 24-48 hours standard |
| Cost Per Package | $3-7 final mile | $8-15 total journey |
| Automation Level | High-speed sorting, route optimization | Bulk processing, inventory management |
| Geographic Coverage | 5-20 mile radius | Regional/multi-state |
| Q4 Peak Flexibility | Rapid route adjustment, local contractor scaling | Capacity constraints, longer lead times |
The strategic advantage lies in the hybrid model. Titan Network sellers who layered last mile stations onto existing DC infrastructure reduced delivery times by 30-50% while maintaining inventory depth. One member switched from pure DC fulfillment to a hybrid approach, cutting failed deliveries by 21% year-over-year during Q4’s most challenging period. For more context on innovative approaches, check out this guide on 3d print amazon strategies transforming fulfillment models.
Selection criteria focus on three key areas: proximity to high-value customer clusters, automation capabilities that reduce labor cost per package, and flexibility to handle volume surges without compromising delivery windows. The stations excel at handling the “final sprint” while DCs manage the “heavy lifting” of inventory storage and regional distribution. For more insights on logistics and Amazon fulfillment, see Amazon logistics.
Strategic Last Mile Delivery Station Location Planning, Mapping Routes to Margin
Location planning transforms from guesswork into profit engineering when you overlay historical order heatmaps with population density data. The methodology starts with identifying your highest LTV zip codes, then calculating optimal station placement to minimize average delivery distance while maximizing daily route density. To further understand demand patterns, review insights on most sold items on amazon which can influence location strategy.
The implementation process requires three data inputs: customer order frequency by geographic cluster, average order value by delivery zone, and current delivery failure rates by distance from existing fulfillment points. Titan Network’s territory planning system automates this analysis, but manual route audits using tools like Route4Me or OptimoRoute provide actionable insights within 48 hours.
Real-world validation comes from a Titan member who shifted station placement 7.2 miles closer to their highest LTV zip codes. The result: 15% boost in signature delivery compliance and measurable reduction in fuel spend per package. Top-performing metropolitan areas for station ROI include Atlanta’s northern suburbs, Dallas-Fort Worth’s dense residential corridors, and Seattle’s eastside communities where Prime expectations drive premium pricing tolerance.
End-to-End Package Flow: Station SOPs for Delivery Precision and Efficiency
The profit-protecting SOP starts the moment packages arrive from your distribution center. Every touchpoint must be tracked: DC hand-off scan → station arrival verification → automated sort by route → vehicle load-out by delivery sequence → final delivery with proof-of-delivery capture and timestamped photos.
The “3-Minute Rule” governs pre-route scanning: every package must be scanned, sorted, and assigned to a delivery route within 180 seconds of station arrival. Titan-approved processes show average sorting speeds improving from 180 to 110 seconds per package when auto-sorters replace manual systems. This efficiency gain directly impacts your cost per shipment and daily throughput capacity.
Critical checkpoints include real-time exception handling: missed scans trigger immediate loss-prevention protocols and automated notifications to station managers. Each step links to core metrics, throughput rates (target: 600+ packages/hour), error rates (maintain sub-2%), signature capture compliance (aim for 95%+), and fleet dispatch timing (routes launched within 15 minutes of completion).
Optimizing Station Operations: Automation, Fleet Management, and Real-Time Tracking for Maximum EBITDA
Station automation directly attacks your largest operational expense: labor cost per shipment. Conveyor sorters, IoT fleet trackers, and mobile dispatch apps create measurable efficiency gains. Target labor costs at less than 9% of total station spend, with tech investment payback windows averaging 6-9 months for high-volume operations. Titan Network Events
Fleet management requires optimal mixing: cargo vans for suburban routes, e-bikes for dense urban deliveries, and seasonal contractor teams for peak periods. Dynamic route assignment based on real-time traffic and delivery density maximizes daily package throughput while controlling fuel costs. Implement fleet rotation every 4 hours during high-volume days to maintain service levels.
Titan Network automation adoption case studies show consistent results: 35% reduction in manual sorting errors and 22% faster route launches. The operational KPI dashboard should track sort speed (target: 600+ packages/hour), dispatch lag (under 15 minutes), on-time delivery percentage (95%+ target), and exception rate (maintain sub-2% for maximum profitability).
Automated vs. Manual Sorting: Impact Analysis, Use Cases, and Best Practices
The breakeven point for automation investment typically occurs at 400+ packages daily, where labor costs exceed equipment amortization. Manual sorters average 250 parcels per hour with 3-5% error rates, while automated systems process 600+ parcels hourly with sub-1% accuracy. The ROI calculator method factors equipment cost, labor savings, and error reduction over 24-month periods.
Phased implementation reduces operational risk: start with peak-hour automation during Q4, then expand to full-day coverage based on volume thresholds. One Titan Network seller cut sort-to-ship time by 52% after automation rollout, achieving payback in under 9 months through reduced labor costs and eliminated re-sort penalties.
| Criteria | Manual Sorting | Automated Systems |
|---|---|---|
| Processing Speed | 250 parcels/hour | 600+ parcels/hour |
| Error Rate | 3-5% average | Sub-1% with scanning |
| Labor Cost | $18-25/hour per sorter | $0.12-0.18 per package |
| Scalability | Linear staff increases | Exponential throughput gains |
For a deeper dive into Amazon seller strategies, check out how to sell on Amazon.
Vehicle Types for Last Mile Station Delivery: Which Maximizes Delivery Margins for Amazon Sellers?
Vehicle selection directly impacts cost per mile and delivery density optimization. E-bikes excel in urban environments, cutting delivery lag times by 14% versus vans in congested zones while maintaining $0.85 per mile operating costs. Cargo vans dominate suburban routes with higher parcel capacity but face $2.20 per mile costs including fuel and maintenance.
The selection framework prioritizes volume thresholds and area demographics: e-bikes for routes under 15 packages in dense urban cores, cargo vans for 20+ package suburban circuits, and mixed fleets for hybrid territories. Insurance considerations require completion within 20 minutes of vehicle acquisition, while 3PL contractor SOPs must specify vehicle maintenance standards and delivery protocols.
A Titan Network peer in Manhattan scaled high-density drop-offs using 70% e-bike, 30% van fleet composition. Results: 22% reduction in per-package delivery costs and 18% improvement in delivery window compliance during peak hours when traffic congestion typically destroys profit margins.
Technology Stack for Advanced Last Mile Delivery Stations in 2025, Tools for Tactical Sellers

Route optimization software forms the profit-protecting foundation: platforms like Onfleet and Wise Systems integrate real-time traffic data with delivery density algorithms to minimize miles driven per package delivered. Live fleet tracking prevents the 8-12% margin erosion caused by off-route diversions and unauthorized stops. Titan Network Workshops
Implementation requires systematic onboarding within 72 hours: API integration with existing inventory systems, driver mobile app deployment, and customer-facing delivery portal activation. Titan Network’s trusted vendor relationships provide negotiated pricing and expedited setup for proven platforms that deliver measurable ROI within 45-60 days.
| Software Category | Top Platform | Key ROI Feature | Avg. Payback Period |
|---|---|---|---|
| Route Optimization | Wise Systems | Dynamic re-routing | 3-4 months |
| Fleet Tracking | Onfleet | Real-time GPS monitoring | 2-3 months |
| Customer Communication | Narvar | Proactive delivery alerts | 4-6 months |
| Analytics Dashboard | Shipwell | Cost-per-mile tracking | 6-8 months |
Common Station Challenges & Tactical Solutions: Margin Rescue SOPs
Failed drop-offs represent the highest-cost operational failure, averaging $8-12 in lost margin per occurrence. The margin rescue SOP requires real-time rerouting within 3 minutes of delivery failure, followed by proactive customer notification via automated SMS with revised delivery windows. Traffic delays trigger dynamic route resequencing to maintain delivery commitments.
Scan errors create inventory discrepancies that compound into costly investigations. The prevention protocol mandates dual-scan verification at package handoff points, with immediate exception alerts to station managers. Tech outages require backup manual processes that maintain 85% operational capacity during system recovery periods. For a research-based perspective on reducing last mile delivery costs, see this external resource.
Holiday peak performance validates your SOPs under maximum stress. One Titan peer faced 19% average delays during peak week but implemented real-time customer communication and flexible delivery windows, reducing delivery failures to sub-2% while maintaining customer satisfaction scores above baseline levels.
Case Studies: Titan Network Sellers Maximizing Profit Levers at Last Mile Stations
Case A: Electronics Brand Delivery Optimization
Problem: 7-figure electronics seller struggling with 68% on-time delivery rate in competitive urban markets, losing customers to faster competitors.
Solution: Implemented Titan Network’s station proximity analysis and hybrid fleet deployment, positioning micro-stations within high-LTV zip codes.
Outcome: 23% improvement in on-time deliveries and 4-point margin increase within 90 days, generating $89K additional EBITDA in Q4.
The second case demonstrates integrated technology and operational excellence. A Titan peer managing $8M annual volume adopted comprehensive station SOPs combining automated sorting, real-time fleet tracking, and proactive customer communication protocols. The systematic approach cut cost per unit by $1.24 while scaling peak volume capacity by 40%, unlocking $137K additional EBITDA during Q4’s critical selling period.
Both cases emphasize the accountability factor: regular peer mastermind sessions provided ongoing optimization insights and prevented operational drift that typically erodes initial gains within 6-12 months of implementation. For additional strategies on Amazon positioning, visit Amazon positioning. For academic research on last mile delivery, see this authoritative study.
FAQs: Last Mile Delivery Station Best Practices for Advanced Amazon Sellers

Most Critical Questions for $1M+ Sellers
Q: What’s the minimum daily volume threshold for dedicated station investment?
A: 400+ packages daily justifies dedicated infrastructure. Below this, leverage existing 3PL networks with station proximity requirements.
Q: How do I fix real-time tracking failures in under 7 minutes?
A: Implement backup cellular data connections and manual GPS ping protocols. Train drivers on 3-step recovery: restart device, manual location update, dispatch notification.
Q: Which urban congestion hack delivers the highest ROI?
A: Time-window delivery clustering: group deliveries by 2-hour windows within 0.5-mile radius. Reduces route time by 18-25% in dense metropolitan areas.
Q: What’s the fastest path to measurable margin improvement?
A: Start with route optimization software integration. See results within 45 days through reduced fuel costs and improved delivery density.
Q: How do I evaluate last mile delivery station performance against traditional fulfillment?
A: Track cost per delivered package, delivery success rate, and customer satisfaction scores. Stations should deliver 15-30% cost reduction with 20%+ speed improvement.
Q: What Titan Network resources accelerate station optimization?
A: Access proven SOPs, peer mentorship calls, and operational audit frameworks designed specifically for 6-8 figure Amazon sellers scaling delivery operations.
Titan Network Systems & Mentorship: Scalability, Accountability, and Masterminding Your Last Mile Advantage
The operational complexity of last mile delivery station optimization demands peer-level expertise and systematic accountability. Titan Network’s proprietary audit frameworks identify profit leaks within 72 hours, while mastermind sessions provide real-time troubleshooting from sellers managing similar volume thresholds and geographic challenges.
The systematic approach includes plug-and-play station SOPs, vetted technology vendor relationships, and ongoing operational reviews that prevent the typical 6-month performance degradation seen in solo implementations. OPEX tracking dashboards provide weekly margin visibility, ensuring every operational decision ties directly to EBITDA impact.
Member survey data validates the acceleration factor: 94% of Titan Network participants reported faster cashflow gains after joining station optimization tracks, with average implementation timelines reduced by 40% compared to independent execution. The peer accountability structure maintains operational excellence beyond initial setup phases.
Titan Network Advantage: Access to $100M+ collective experience in last mile delivery station optimization, proven SOPs, and ongoing peer mentorship that transforms operational challenges into systematic profit drivers.
Mastering Last Mile Delivery Station Operations: Your Path to Sustainable Margin Expansion
Last mile delivery station mastery separates plateau-bound sellers from those scaling systematically toward 8-figure operations. The tactical frameworks outlined, from strategic location planning to automated sorting implementation, provide immediate profit levers for established Amazon brands ready to optimize beyond basic fulfillment.
The evidence is clear: sellers implementing comprehensive last mile delivery station strategies achieve 15-30% cost reductions while improving delivery performance metrics that directly impact customer lifetime value. The technology stack integration, vehicle selection optimization, and operational SOP implementation create compounding advantages that strengthen competitive positioning.
Success requires more than tactical knowledge, it demands peer-level accountability and systematic execution. The complexity of coordinating multiple operational variables, from route optimization to technology integration, benefits significantly from proven frameworks and ongoing mentorship from sellers who’ve navigated identical challenges.
For Amazon sellers managing $1M-$10M+ annual volume, last mile delivery station optimization represents a critical profit center that extends far beyond cost reduction. The operational excellence gained through systematic implementation creates sustainable competitive advantages while building the infrastructure foundation necessary for continued scale and margin expansion. For more tips and industry updates, visit the Titan Network blog.
Frequently Asked Questions
What is a last mile delivery station and how does it differ from a traditional distribution center?
A last mile delivery station is a hyperlocal fulfillment hub located within 2-15 miles of dense customer clusters, focused exclusively on the final leg of delivery. Unlike traditional distribution centers that handle large regional volume and storage, last mile stations prioritize speed and precision in doorstep delivery, managing smaller, time-sensitive shipments to maximize efficiency and reduce transit times.
How do last mile delivery stations impact the EBITDA of Amazon brands generating over $1 million in revenue?
Last mile delivery stations directly influence EBITDA by controlling the most expensive logistics segment, last mile shipping, which can account for up to 53% of total shipping costs. By reducing fuel expenses, accelerating delivery times, and improving delivery success rates, these stations help Amazon brands protect margins and improve cash flow in a segment notorious for margin erosion.
What are the key operational strategies used at last mile delivery stations to reduce shipping costs and improve delivery speed?
Key strategies include hyperlocal route optimization, automated sorting to reduce manual labor, real-time fleet tracking for dynamic dispatch, and SOPs focused on delivery precision and signature capture. These tactics streamline operations, cut fuel consumption, and minimize delivery failures, directly boosting margin and operational efficiency.
Why is proximity to dense customer clusters crucial for the efficiency and profitability of last mile delivery stations?
Proximity reduces the distance and time required for final delivery, cutting fuel costs and vehicle wear while enabling faster turnaround and higher delivery success rates. Being within 2-15 miles of dense customer bases allows stations to leverage route density, improving fleet utilization and ultimately expanding EBITDA by controlling the costliest logistics segment.